

Most webinar hosts can tell you how many people registered. Far fewer can tell you why half of them never showed up, or what made the other half stay until the last slide.
Webinar analytics close that gap. They tell you, in real numbers, whether your audience showed up, stayed, engaged, or quietly dropped off partway through.
This guide breaks down every webinar metric worth tracking, the webinar performance metrics that separate an average session from a genuinely great one, and exactly how to turn that data into a repeatable, revenue-generating process.
No fluff, no vague “engagement matters” platitudes. Just the numbers, the formulas, and the moves that actually work.
What Are Webinar Analytics?
Think of it as the flight recorder for your webinar. If something goes wrong, or brilliantly right, the data tells you precisely where.
A single number like “200 people registered” tells you almost nothing on its own. It only starts telling a real story once you compare it against how many of those registrants became genuine webinar attendees.
That comparison, registrants versus attendees versus engaged attendees versus converted attendees, is the backbone of everything else in this guide.
Why Webinar Attendance Alone Isn’t Enough
Webinar attendance tells you who showed up. It doesn’t tell you who cared.
Two webinars can both have a 45% attendance rate and produce completely different results, one full of engaged buyers, the other full of people who joined, muted the tab, and made lunch. Attendance is the entry point into your analytics, not the conclusion.
Stop Guessing Why Half Your Registrants Never Showed Up. Start Acting Now.
Webinar Metrics, KPIs, and Performance Metrics You Should Be Tracking
There’s no shortage of numbers a webinar platform can throw at you. The trick is knowing which webinar KPIs actually move the needle and which ones are just noise dressed up as a dashboard.
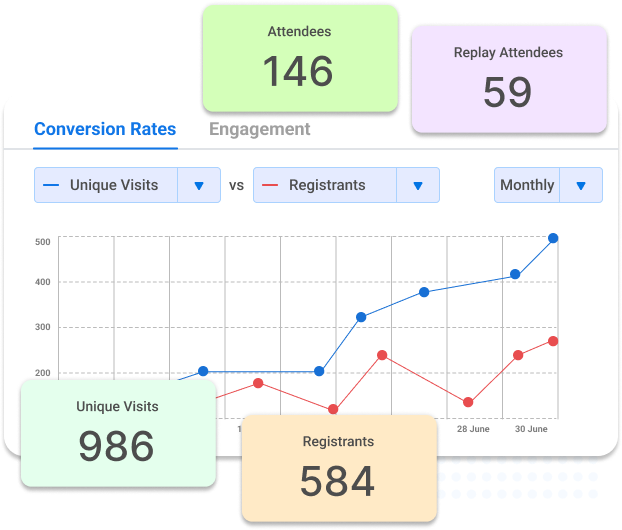
Below are the webinar performance metrics worth watching, split into two groups: what happens before your webinar starts and what happens once people are actually in the room.
Top-of-Funnel Webinar KPIs
| Metric | Formula | What It Tells You |
| Registration Rate | (Registrants ÷ Landing Page Visitors) x 100 | How compelling your offer and landing page copy are |
| Webinar Attendance Rate | (Live Attendees ÷ Registrants) x 100 | Whether your reminders and timing actually worked |
| Cost Per Registrant / Lead | Total Webinar Cost ÷ Registrants (or Leads) | What each new contact actually costs you |
Engagement, Conversion, and Post-Event Metrics
| Metric | Formula | What It Tells You |
| Average Watch Time / Stick Rate | Total Watch Time ÷ Webinar Length | How long you held attention before people wandered off |
| Engagement Rate | (Poll Responses + Chat Messages + Questions) ÷ Attendees | How “in the room” your audience really was |
| CTA Click-Through Rate | (CTA Clicks ÷ Attendees) x 100 | Whether your offer actually landed |
| Webinar Conversion Rate | (Conversions ÷ Attendees) x 100 | The bottom-line payoff of the whole event |
| Replay Views | Total Replay Plays | How far your content travels after the live session ends |
| Drop-off Rate | (Early Leavers ÷ Total Attendees) x 100 | Exactly where your content lost the room |
| Post-Webinar Survey Score | Average of post-event ratings | Whether attendees liked it enough to come back |
You don’t need a data science degree to track all this. Most of it should already be sitting in your webinar reports, updated the moment your session ends.
Before we move forward, here is a quick video that helps you understand how the right tool makes tracking webinar analytics easier:
Track Every Webinar KPI in One Dashboard the Moment Your Session Ends
Average Webinar Attendance Rate and Webinar Conversion Rates in 2026
Here’s the part most guides quietly skip: what’s actually good versus what’s just fine.
The numbers below give you a real benchmark to measure yourself against, not a vague “it depends” shrug.
Average Webinar Attendance Rate
According to DemandSage’s 2026 analysis, the average webinar attendance rate sits between 35% and 45% of registrants.
If your webinar attendance is hovering around 40%, you’re not underperforming; you’re sitting comfortably on the industry curve. Anything meaningfully below that is your cue to look at promotion and reminder timing, not your slide deck.
Average Webinar Conversion Rate
That same DemandSage data puts average webinar conversion rates at around 56% of attendees taking the desired action.
For B2B marketers specifically, webinars remain one of the highest-trust content formats out there. The Content Marketing Institute’s latest B2B research found more than half of marketers rank webinars among their best-performing distribution channels, right up there with in-person events.
Quick reference, so you’re not googling this mid-meeting:
- Webinar attendance rate: 35-45% is average; above 50% is genuinely strong
- Webinar conversion rate: around 50-56% is typical for a well-run session
- Drop-off spikes: a sudden exit at one timestamp usually means one slide is the problem, not your whole webinar
How to Calculate Webinar ROI (With a Real Example)
Attendance and engagement matter, but ROI is the number that gets you invited back to the budget meeting.
The ROI Formula
The formula is simple, even if gathering the inputs takes a little digging:
| ROI = ((Revenue Attributed to the Webinar − Total Cost) ÷ Total Cost) x 100 |
A Worked Example
Here’s how that plays out in practice:
- Total cost (platform, promotion, staff time): $2,000
- Revenue from webinar-sourced deals: $10,000
- ROI = (($10,000 − $2,000) ÷ $2,000) x 100 = 400%
If your real goal is to grow your sales rather than just collect email addresses, this is the one number worth reporting every single time.
Also, if you are looking for details, here is a guide on Webinar ROI that can help you move a step ahead.
How to Evaluate Your Webinar Metrics Step by Step
Data without a process is just a spreadsheet nobody reopens. Here’s the order that actually works, from first glance to final export.
Step 1: Start With the Big-Picture Snapshot
Before diving into individual charts, look at the whole funnel at once: visits, registrants, attendees, replay viewers.
This single view tells you where the biggest leak happens before you even plan your next live webinar.
Step 2: Track the Registration-to-Attendance Funnel
This is where you find out whether your promotion worked or your reminder emails quietly failed.

A weak funnel here is usually a lead generation problem, not a content problem, so don’t rewrite your slides just yet.
Step 3: Watch Engagement in Real Time
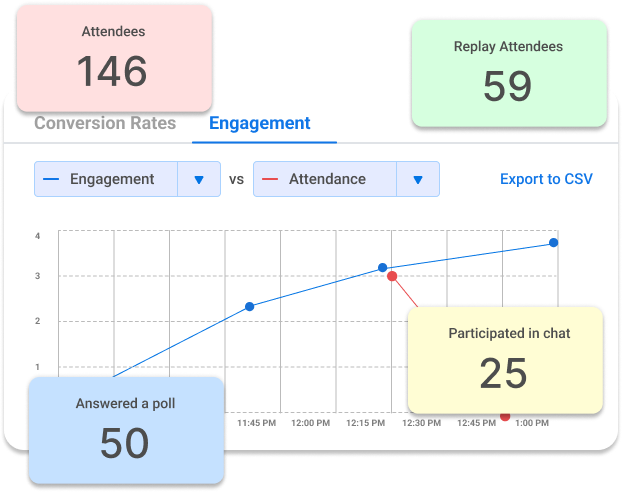
Chat activity, poll responses, and live questions are the closest thing you’ll get to reading the room without physically being in it.
Polls are basically your webinar’s applause meter. Whatever you learn here should shape how you host a webinar next time, right down to where you place your first one.
Step 4: Study Your Replay Analytics
Most guides forget that a huge chunk of your audience never shows up live, they watch later, often at 11pm in their pajamas.
Your recordings and replays can quietly outperform the live session if you tag and time-stamp them properly.
Step 5: Export and Cross-Reference With Your CRM
Raw numbers mean little until they sit next to pipeline data.
Piping webinar data into your CRM through your existing integrations is what turns “200 attendees” into “12 qualified opportunities.”
Calculate Your Own Webinar ROI With Data That’s Already Waiting for You
How to Use Webinar Analytics to Improve Every Future Webinar
Knowing your numbers is step one. Actually doing something with them is what separates hosts who improve every quarter from hosts who just collect reports.
Here’s how different teams put the same data to very different, very useful work.
For Marketing and Lead Generation Teams
Marketing teams use drop-off timestamps and engagement data to rewrite weak sections of a presentation before the next run.
If a particular topic consistently pulls a stronger attendance rate, that’s your cue to build your next webinar marketing campaign around it instead of guessing at a new theme.
For Sales Teams
Sales teams use engagement data (who asked questions, who clicked the offer, who stayed until the end) to prioritize follow-up calls instead of treating every attendee the same.
This is also where product demos benefit most from analytics, since a prospect’s exact moment of drop-off often tells you precisely which feature or objection to address first.
For Training, Onboarding, and Internal Communication Teams
Internal teams use completion rate and quiz or poll accuracy to confirm whether training content actually landed, not just whether people logged in.
A multi-session webinar series makes this especially easy to track, since you can compare attendance and engagement session over session and catch drop-off before it becomes a pattern.
The Real Benefits of Tracking Webinar Performance Metrics
Once tracking becomes a habit rather than an afterthought, the payoff shows up in places beyond the obvious attendance number.
- Sharper content decisions. You stop guessing which topics land and start knowing.
- Personalized follow-ups. Someone who asked three questions live deserves a very different email than a no-show.
- Honest benchmarking over time. Today’s average becomes next quarter’s floor, not its ceiling.
- Format flexibility. Strong evergreen data can graduate a one-off session into a full CourseNinja offering.
- Consistency at scale. Once a format proves itself, automated webinars let you repeat the win without repeating the effort.
- Reach beyond marketing. The same tracking logic applies to customer onboarding sessions, not just lead-gen events.
Check out this quick case study to understand how a good webinar tool like WebinarNinja can help you generate leads and revenue effectively:
Where AI Actually Helps With Webinar Analytics
AI isn’t here to replace your judgment. It’s here to replace your busywork, which frankly needed replacing.

A modern webinar platform can now:
- Draft and test higher-converting registration headlines automatically, so you’re not staring at a blank page at 11pm the night before launch
- Review your session against proven conversion frameworks and hand back specific fixes, not a vague “make it more engaging” note
- Scan live chat for repeated questions and answer the common ones instantly, so the host stays focused on the room instead of the keyboard
- Turn a finished webinar straight into blog posts, social snippets, and follow-up emails, shrinking the “what do we even do with this recording” scramble down to minutes
What This Looks Like in Practice
If you want to see this in action rather than just read about it, WebinarNinja’s AI webinar creator tools handle most of this without you needing to write a single prompt.
Common Challenges in Webinar Analytics (and How Not to Trip Over Them)
Tracking webinar metrics sounds simple until you actually sit down with the dashboard. Here’s where most hosts get stuck and how to get unstuck faster.
Data and Interpretation Challenges
- Data overload. Pick 3-4 metrics tied to your actual goal and ignore the rest until you’re comfortable.
- Data accuracy. Check your tracking integrations regularly; dirty data just means you’re confidently wrong.
- Interpreting the story, not just the numbers. A drop-off spike at minute 22 isn’t bad luck; it’s a slide that needs rewriting. If fifteen people leave the second you mention pricing, that’s not a coincidence; that’s feedback.
- Benchmarking against yourself first. Compare against last quarter before you compare against competitors. It’s a fairer fight and less humbling.
People and Privacy Challenges
- Audience privacy. Attendee data is personal data. Under GDPR’s consent requirements, you need clear, specific, and freely given consent before using it beyond running the event itself.
- Internal use cases count too. Teams that train and communicate internally need the same analytical rigor as external marketing webinars, just with different privacy stakes.
Get Registration, Engagement, and Replay Data in One Dashboard
The Bottom Line on Webinar Analytics
Webinar analytics aren’t there to make you feel guilty about a mediocre attendance rate. They’re there to tell you exactly what to fix before your next session, and exactly what to repeat because it’s already working.
The hosts who improve quarter-over-quarter aren’t the ones with the fanciest slides. They’re the ones who treat every webinar as a small experiment, track the results honestly, and let the data settle arguments that used to be settled by gut feeling and whoever spoke loudest in the debrief meeting.
Start with three or four metrics that map to your actual goal, benchmark them against the industry numbers above, and revisit them after every single session. That habit alone will outperform most “webinar strategy” documents gathering dust in a shared drive.
If you’re looking for a platform that makes this entire process less of a chore, WebinarNinja bundles registration tracking, live engagement data, replay analytics, and reporting into one dashboard, so the insight is waiting for you the moment your webinar ends, instead of being buried across three different tools.
Frequently Asked Questions
What is a good webinar attendance rate?
A good webinar attendance rate typically falls between 35% and 45% of registrants, based on current industry benchmarks. Anything above 50% is considered strong, and it usually means your reminder sequence and registration timing are working well together. Hosts using automated, multi-touch reminder emails, a feature built into most modern webinar platforms with advanced analytics, including WebinarNinja, tend to land at the higher end of that range.
What is considered a good webinar conversion rate?
Industry averages put webinar conversion rates at around 50-56% of attendees taking the desired action, whether that's a purchase, sign-up, or demo request. Your realistic target depends heavily on your offer strength, your CTA placement, and how well your content matched what registrants expected when they signed up.
How do you calculate webinar engagement rate?
Add up poll responses, chat messages, and questions asked, then divide that total by the number of attendees. A rising engagement rate across multiple sessions usually means your content and delivery are improving together, not just one or the other.
What's the difference between webinar attendance rate and registration rate?
Registration rate measures how many landing page visitors sign up before the event. Attendance rate measures how many of those registrants actually show up live. A strong registration rate with a weak attendance rate almost always points to a timing, reminder, or time-zone problem rather than a content problem.
How is webinar ROI calculated?
Subtract your total webinar cost from the revenue attributed to the webinar, divide that number by the cost, then multiply by 100. It's the same ROI formula marketers use for any campaign, just pointed specifically at your webinar spend and results.
What is the best day and time to host a webinar for maximum attendance?
According toresearch on webinar timing patterns, late morning slots around 11 AM tend to produce the highest attendance rates, with early afternoon close behind. Tuesday through Thursday consistently outperform Mondays and Fridays, largely because attendees have cleared their weekly backlog but haven't mentally checked out for the weekend yet.
How long should a webinar be?
Most high-performing webinars run around 45 minutes of core content followed by 10 to 15 minutes of live Q&A, according to the same webinar timing research. Sessions that stretch past 60 minutes tend to see a noticeable rise in drop-off rate, particularly in the final stretch.
What is a good drop-off rate for a webinar?
There's no single universal number here, since drop-off depends heavily on webinar length and topic, but a healthy session usually holds at least 70-80% of attendees through the core content before the final CTA. A sharp, sudden spike at one specific timestamp is more useful than the overall rate, since it points you straight to the slide or topic that needs work.
Do webinar hosts need to worry about GDPR when tracking attendee data?
Yes, if you have attendees based in the EU or UK. You need a clear, lawful basis and explicit, freely given consent before using attendee data for anything beyond running the actual event, including future marketing emails or list building.
What's the difference between webinar analytics and webinar reports?
Webinar analytics refers to the underlying metrics and data points themselves, things like attendance rate, engagement rate, and conversion rate. Webinar reports are the formatted, readable summaries of that same data, usually generated automatically by your platform so you're not exporting raw numbers into a spreadsheet by hand.
How can I improve my webinar attendance rate?
Start with your reminder cadence: a well-timed sequence of confirmation, one-day-before, and one-hour-before emails consistently lifts show-up rates. Beyond that, pay attention to registration-to-live-event timing, since shorter gaps generally produce stronger attendance, and make sure your topic promise in the registration copy matches what you actually deliver live.
What tools should I use to track webinar analytics?
Look for a platform that tracks the full funnel automatically, registrations, attendance, watch time, chat and poll engagement, and replay views, without requiring manual exports for every metric. WebinarNinja, for example, surfaces most of this directly inside its reporting dashboard, which saves a fair amount of the spreadsheet-stitching that used to eat up a Monday morning.
Want to host a webinar for free?
Use WebinarNinja to teach, improve marketing, and grow your sales.



![How to Choose & Set Webinar Virtual Background [+Best Practices]](https://webinarninja.com/blog/wp-content/uploads/2025/01/Feature_WN_How-to-Choose-Set-Webinar-Virtual-Background-Best-Practices.png)