“A full registration list doesn’t mean a full audience.”
Many virtual events attract likes, claps, and polite comments that might feel good, but what matters is how many people actually show up, engage, and take action. No doubt, you need the virtual event metrics to uncover the reality.
As someone who has spent years helping businesses optimize virtual events, I’ve seen this mistake far too often. Many hosts assume their event is a hit, only to realize later that drop-off rates are high, engagement is low, and conversions fall flat.
The biggest challenge? Not knowing what to track.
That’s why I’ve compiled this detailed guide on key metrics for virtual event success to measure what truly matters, boost engagement, generate leads, and turn your virtual event into real success. Let’s get started.
What Are Virtual Event Metrics & KPIs?
Virtual event metrics and KPIs (Key Performance Indicators) are the numbers that tell you if your event was a hit or a miss. Consider them as a scoreboard for engagement, attendance, and ROI.
They help you understand how well your event performed, whether attendees stayed engaged, and if your efforts paid off. Common metrics include registrations, live attendance rate, engagement time, poll participation, and post-event feedback.
For example, if 500 people signed up for your webinar, but only 200 showed up, that’s a 40% attendance rate—something to improve next time! Similarly, if attendees drop off within 10 minutes, your content might need tweaking.
Tracking these webinar analytics will help you refine future events, ensuring better audience retention and higher conversions.
Numbers don’t lie, so use them wisely!
How to Measure Success for Virtual Events: Tracking Event Metrics
Hosting a virtual event is one thing, but knowing whether it actually worked is another. Here are some key virtual event metrics that help measure success and improve future events.
Pre-Event Metrics to Track
Before your virtual event even begins, you can predict success by analyzing who’s registering, how they’re engaging, and what’s driving sign-ups.
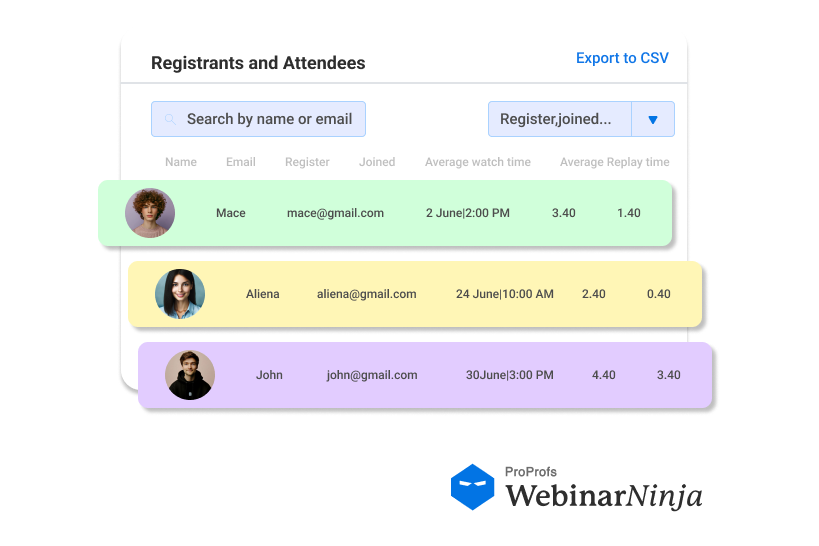
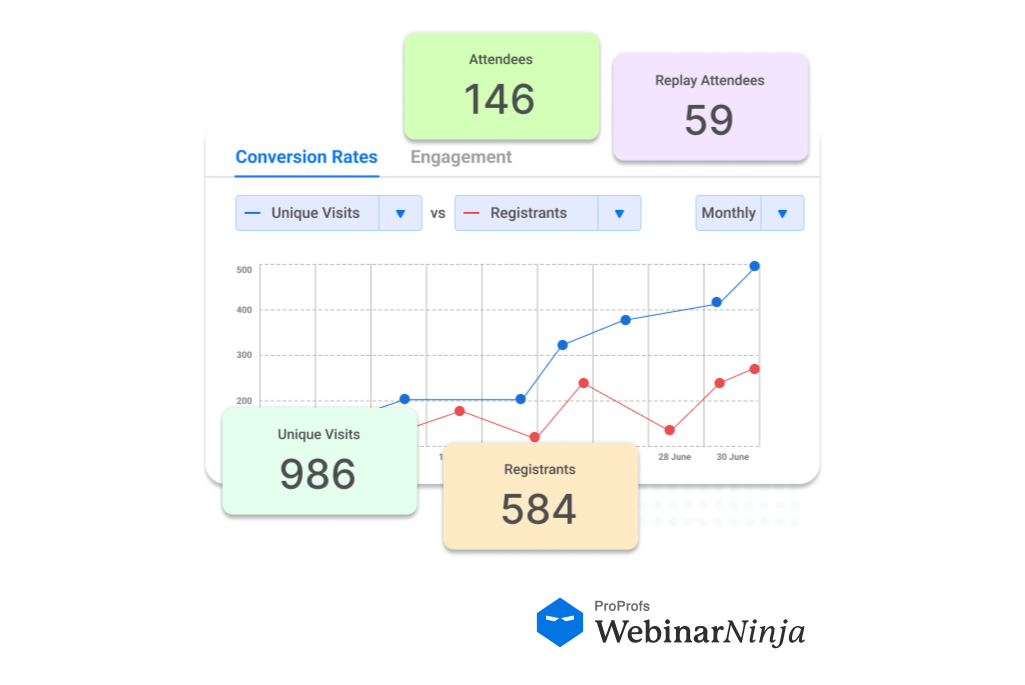
1. Registration Numbers & Source Tracking
The number of people registering for your event gives an early indication of interest. Tracking where registrations come from helps determine which promotional channels are most effective.
- How many people are signing up?
- Which platforms (email, social media, website) are bringing in the most registrations?
Example: If you promoted the event on LinkedIn, Twitter, and email, but 70% of registrations came from email, that’s a clear sign email marketing worked best. Next time, you can invest more in emails and tweak your social strategy.
2. Audience Demographics & Interest Levels
Understanding who is signing up helps you assess if you are reaching the right audience.
- Who is signing up? (Job titles, industries, locations)
- Are they your target audience, or is there a mismatch?
Example: If your event is about B2B marketing trends, but half of your registrations are students, you might need to refine your messaging to attract professionals.
3. Pre-Event Engagement
How people interact with pre-event content—such as emails, teaser videos, and discussion forums—can predict attendance and engagement levels.
- Are people opening event emails?
- Are they adding the event to their calendars?
- Are they interacting with pre-event content (like polls, discussion forums, or teaser videos)?
Example: If only 30% of registered attendees opened the event reminder email, you might need a more compelling subject line or a last-minute incentive like “Join to win an exclusive eBook!”
In-Event Engagement Metrics
This is where the real action happens. If people tune in but leave within minutes, that’s a sign something isn’t clicking. Here are the key engagement metrics to track during the event.
1. Live Attendance Rate
This metric tells you how many registered attendees actually showed up. A low attendance rate could indicate a weak follow-up strategy or scheduling conflicts.
- How many of the registered attendees actually showed up?
- What’s the drop-off rate (how long do they stay)?
Example: If your event had 1,000 registrations but only 350 people attended, that’s a 35% attendance rate. If attendance significantly drops after the first session, it might suggest that attendees didn’t find the opening compelling. To improve this, consider introducing an engaging icebreaker, an exclusive giveaway, or an interactive poll at the start to keep attendees hooked.
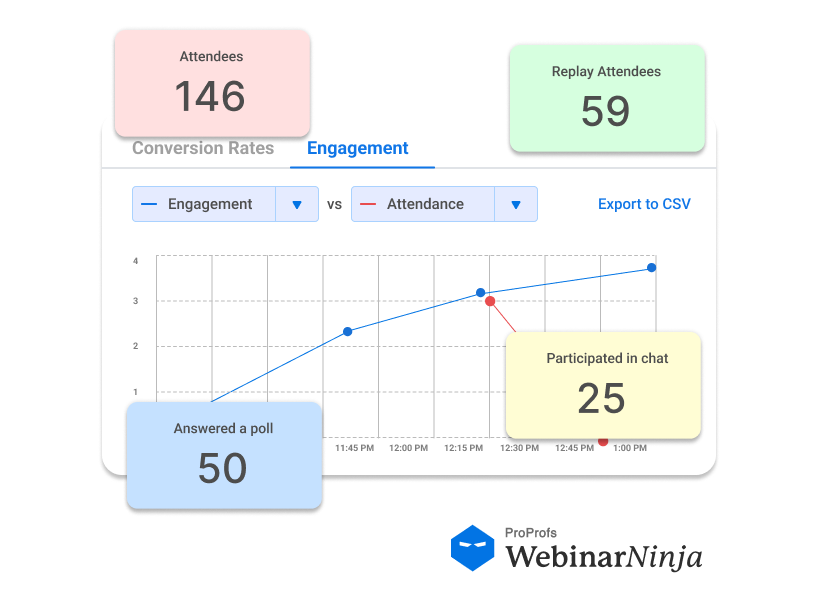
2. Session Engagement & Interaction
Engagement levels show whether attendees are actively participating or just passively watching. High engagement means people find the content valuable.
- Are attendees asking questions in the Q&A?
- How many are participating in polls or surveys?
- Are they using the chat feature to network?
Example: If your poll gets only 10% participation, your audience might be passive listeners. Instead of just asking a question, you could gamify the experience: “Answer the poll for a chance to win a free consultation!”
3. Time Spent in Event
The average duration attendees stay in your event gives insight into how engaging the sessions are.
- Are people staying for the full session or leaving halfway?
- Which sessions had the highest/lowest retention?
Example: If attendees stay for an average of 20 minutes in a 60-minute webinar, you might need more interactive elements, like live demos or breakout rooms, to keep them engaged.
4. Networking & Social Sharing
A great virtual event fosters connections among attendees and encourages social media conversations.
- How many attendees are connecting with each other?
- Are people sharing event highlights on social media?
Example: If attendees are tagging your event on LinkedIn with insights from the session, that’s a sign of high engagement. Encourage this by creating an event hashtag and giving a shout-out to attendees who use it.
Post-Event Metrics to Analyze
Once the event is over, it’s time to evaluate its true impact. This is where you measure conversion, content performance, and audience retention.
1. On-Demand Views & Replay Engagement
The number of people watching the event replay shows how valuable your content remains after the live event.
- How many people watched the event recording?
- Are views increasing over time?
Example: If 300 people watch the replay after the event, that means your content has long-term value! You can repurpose it into blog posts, YouTube clips, or social media snippets.
2. Lead Generation & Conversions
This metric tells you whether the event led to valuable business outcomes, such as lead capture and sales.
- Did the event generate new leads?
- How many attendees took the desired action (signing up for a demo, downloading a resource, etc.)?
Example: If 10% of attendees book a meeting with your sales team, that’s a strong indicator of event ROI. If it’s lower, maybe the CTA (call to action) wasn’t clear or compelling enough.
3. Drop-off & Bounce Rates
Analyzing what attendees do after the event (stay on your website or leave immediately) helps assess their level of interest.
- Did people leave the post-event page quickly?
- Were they browsing other resources on your site?
Example: If most visitors left your landing page within seconds, your post-event content might not be engaging. Try offering a free resource or follow-up Q&A session to keep them interested.
Measuring Attendee Satisfaction Through Feedback
Numbers don’t tell the whole story. Attendee feedback gives valuable insight into their experience.
1. Post-Event Surveys & Ratings
Surveys help you gauge overall satisfaction and collect suggestions for improvement.
- How would attendees rate the event on a scale of 1-10?
- What did they like/dislike?
Example: If your event scores an 8.5/10 on average, that’s great! But if the common complaint is “too much talking, not enough engagement,” you know what to fix next time.
2. Net Promoter Score (NPS)
NPS helps measure how likely attendees are to recommend your event to others.
Would attendees recommend the event to others?
Let’s check out how to calculate the NPS score to understand this better:
How to Calculate the NPS:
To calculate your NPS, you can ask attendees questions such as, “On a scale of 0-10, how likely are you to recommend this event to a friend or colleague?”
The attendees may offer you a response out of 10, which can be classified as:
- Promoters (9-10): Enthusiastic attendees who loved the event.
- Passives (7-8): Satisfied but not highly enthusiastic attendees.
- Detractors (0-6): Attendees who were disappointed or unimpressed.
| Formula to Calculate NPS:NPS = % of Promoters − % of DetractorsNPS |
So, if 60% of attendees are promoters, 30% are passives, and 10% are detractors, then:
NPS = 60% − 10% = 50
And, if your NPS is below 50, that suggests a lukewarm response. You can ask follow-up questions like “What could we do better?” to understand why.
3. Social Media Sentiment
Analyzing event-related discussions online helps measure audience perception.
- What are people saying about the event online?
- Are comments positive, neutral, or negative?
Example: If attendees post on LinkedIn saying, “This event gave me great insights!”, that’s a sign of high satisfaction.
Why Track the Virtual Event Success Metrics
Here are some of the major reasons why tracking your virtual event’s success is essential:
1. Understand Audience Engagement & Behavior to Improve Future Experiences
Not all attendees engage the same way—some are highly interactive, while others leave early. Tracking engagement levels helps you refine content and improve retention.
- How many attendees stayed for the full event?
- Which sessions had the highest and lowest retention?
- Were attendees interacting in polls, Q&As, and networking sessions?
Example: If 50% of attendees leave within the first 20 minutes, your opening session might need more excitement. Consider starting with an interactive poll, a compelling story, or a surprise guest speaker to hook them early.
2. Optimize Content & Session Formats to Keep Attendees Engaged
Some topics naturally resonate more with your audience than others. By analyzing session engagement, you can refine your content and event format.
- Which sessions had the most attendees?
- What content type (panel discussions, solo presentations, interactive workshops) was most engaging?
Example: If a keynote speaker’s session had 90% retention, but another session dropped to 40%, it’s a sign that the high-performing session format should be replicated next time.
3. Measure ROI & Business Impact to Justify Your Event’s Value
Virtual events are often lead-generating opportunities. Measuring ROI ensures your event is driving real business outcomes.
- Did the event generate new leads or sales?
- How many attendees signed up for a product demo or service?
- What’s the cost per attendee compared to the revenue generated?
Example: If 1,000 attendees participated and 5% converted into paying customers, you can measure the direct revenue impact. If the conversion rate is low, improving your follow-up strategy can make a difference.
4. Identify Weak Spots & Fix Them for Future Events
Virtual events are continuous learning experiences. Measuring success helps you pinpoint what needs improvement.
- Were there technical issues affecting the event?
- Did attendees find it easy to navigate the platform?
- Were the sessions too long, too short, or lacking interaction?
Example: If post-event surveys indicate that attendees found the sessions too long and not engaging, shortening them or adding interactive breakout rooms can boost engagement next time.
5. Demonstrate Value to Sponsors & Improve Monetization Strategies
Sponsors need to see measurable value from the event to continue supporting it. Tracking sponsor engagement helps improve future sponsorship opportunities.
- How many people saw or interacted with sponsor branding?
- Did attendees visit sponsor booths or sign up for sponsor offers?
Example: If a sponsor’s virtual booth had low engagement, you might offer them a more visible placement or include sponsored giveaways to drive more traffic.
6. Enhance Post-Event Nurturing & Follow-Ups to Retain Attendees
The attendee experience doesn’t end when the event does—tracking engagement helps tailor effective follow-ups.
- What percentage of attendees opened the post-event email?
- Are people watching the event replay or engaging with follow-up content?
Example: If only 15% of attendees open your post-event email, instead of a generic “Thank you for attending” message, try sending personalized event highlights, an exclusive eBook, or a special discount.
7. Prove Event Success to Leadership & Secure Future Budgets
If your company invests in virtual events, proving their effectiveness is key to securing future funding and support.
- What impact did the event have on brand growth?
- How did it compare to past events?
Example: If your event generated 5x more leads than a traditional marketing campaign, presenting this data to leadership can justify increased investment in future events.
Examples of Brands Measuring Virtual Event ROI
Here are some examples of brands that use WebinarNinja for their virtual events:
1. Sales Market Fit: Achieving a 200% Increase in Qualified Leads Through Webinars
The Problem
Sales Market Fit, founded by Gavin Tye, helps companies align their sales strategies with their target market. Initially, Gavin struggled to connect with business founders through LinkedIn, as his outreach messages weren’t yielding the desired engagement.
Without a scalable method to build relationships and generate quality leads, his sales efforts were hitting a roadblock.
The Solution
To overcome this challenge, Gavin turned to webinars as an alternative way to deliver value-driven content. He adopted WebinarNinja, drawn to its affordability and ease of use.
The platform allowed him to set up and host webinars effortlessly, focusing on educating his audience about demand creation and sales strategy.
The Result
By leveraging WebinarNinja, Gavin saw a 200% increase in qualified leads. In one instance, a single webinar generated a lead worth between $20,000 and $25,000. With this success, he has now committed to running webinars more frequently, expecting even greater lead generation in the future.
2. Relayer Benefits: Sustaining Sales Amidst a Pandemic Through Virtual Presentations
The Problem
Relayer Benefits, led by President Mark Jacobson, specializes in safe money products and investment strategies. The company relied heavily on in-person presentations to educate clients and close deals.
However, when the global pandemic hit, these traditional events became impossible, putting their sales and client engagement at risk.
The Solution
To adapt, Relayer Benefits transitioned to virtual presentations using WebinarNinja. The platform’s features, including live and automated webinars, interactive surveys, and material sharing, helped replicate the engagement of in-person events.
The Result
Thanks to WebinarNinja, Relayer Benefits successfully maintained and even grew their sales despite the challenges posed by the pandemic. The ability to continue educating clients virtually ensured steady business growth and proved the effectiveness of measuring virtual event ROI.
Track, Improve & Maximize Your Virtual Event ROI
Measuring the success of your virtual event isn’t just about numbers—it’s about understanding engagement, refining content, and maximizing ROI.
Tracking virtual event performance metrics before, during, and after your event helps you see what’s working, identify gaps, and make data-driven improvements for future events. Without this insight, you’re simply guessing.
That’s where a good virtual event platform like WebinarNinja comes in. With built-in event metrics, it helps you monitor registrations, engagement levels, and post-event analytics. By leveraging these insights, you can effortlessly optimize your events, enhance audience experiences, and achieve meaningful business outcomes.
Want to host a webinar for free?
Use WebinarNinja to teach, improve marketing, and grow your sales.

![10 ON24 Alternatives for Virtual Events & Webinars in 2026 [Pros, Cons, Pricing]](https://webinarninja.com/blog/wp-content/uploads/2025/02/Feature_WN_10-ON24-Alternatives-for-Virtual-Events-Webinars-in-2025-Pros-Cons-Pricing-1.png)